A standard LED volume pipeline stacks four discrete latency sources before a single frame hits the wall: sensor readout, tracking processing, engine render, and LED controller handshake. Every link carries its own tolerance.
I have measured volumes at 12 ms total system latency. I have measured the same setup at 47 ms after a tracking firmware update. The difference is the gap between a locked shot and one that slides on every whip pan. The workflow below documents the three-step verification method that exposes exactly where the latency budget goes and what to do about it.
The Glass-to-Glass Latency Chain
Latency in an Unreal-driven LED volume is not a single value. It is a chain of four independent contributors, each measured in milliseconds or sub-frames, each capable of breaking synchronization on its own.
| Stage | Typical Range | Measurable? | Notes |
|---|---|---|---|
| Camera sensor readout | 4–18 ms | Yes (datasheet) | CMOS rolling shutter extends effective delay |
| Tracking system processing | 2–12 ms | Yes (vendor tool) | Mo-Sys, OptiTrack, Stype all expose internal latency |
| Engine render + compositing | 6–20 ms | Yes (stat unit, profiler) | Scales with scene complexity and nDisplay nodes |
| LED controller / scan | 1–8 ms | Limited | Often undocumented at firmware level |
The total glass-to-glass delay lands in the 13–58 ms window for most professional setups. The lower bound requires aggressive optimization across every stage. The upper bound is what you get when each vendor assumes the others will compensate.
Glass-to-glass latency is not a software problem. The last link in the chain — LED controller scan — cannot be reduced from inside Unreal Engine.
The tracking stage deserves scrutiny. FreeD, VIVE Tracker, and optical rigs from OptiTrack and Stype all generate valid transforms, but each introduces a different offset against the camera timecode. UE 5.3 documentation acknowledges this implicitly: Live Link pulls data from the tracking source, but it does not know the source's intrinsic delay.
The render stage scales with shader complexity, anti-aliasing method, and the number of active nDisplay nodes. A scene that renders at 8 ms in solo preview can balloon past 22 ms the moment a second cluster lights up. Always measure render time with the full nDisplay configuration online — never in editor solo preview.
Step 1: Set Up High-Speed Reference Capture
You cannot measure latency you cannot see. The reference capture method is the foundation of the entire workflow.
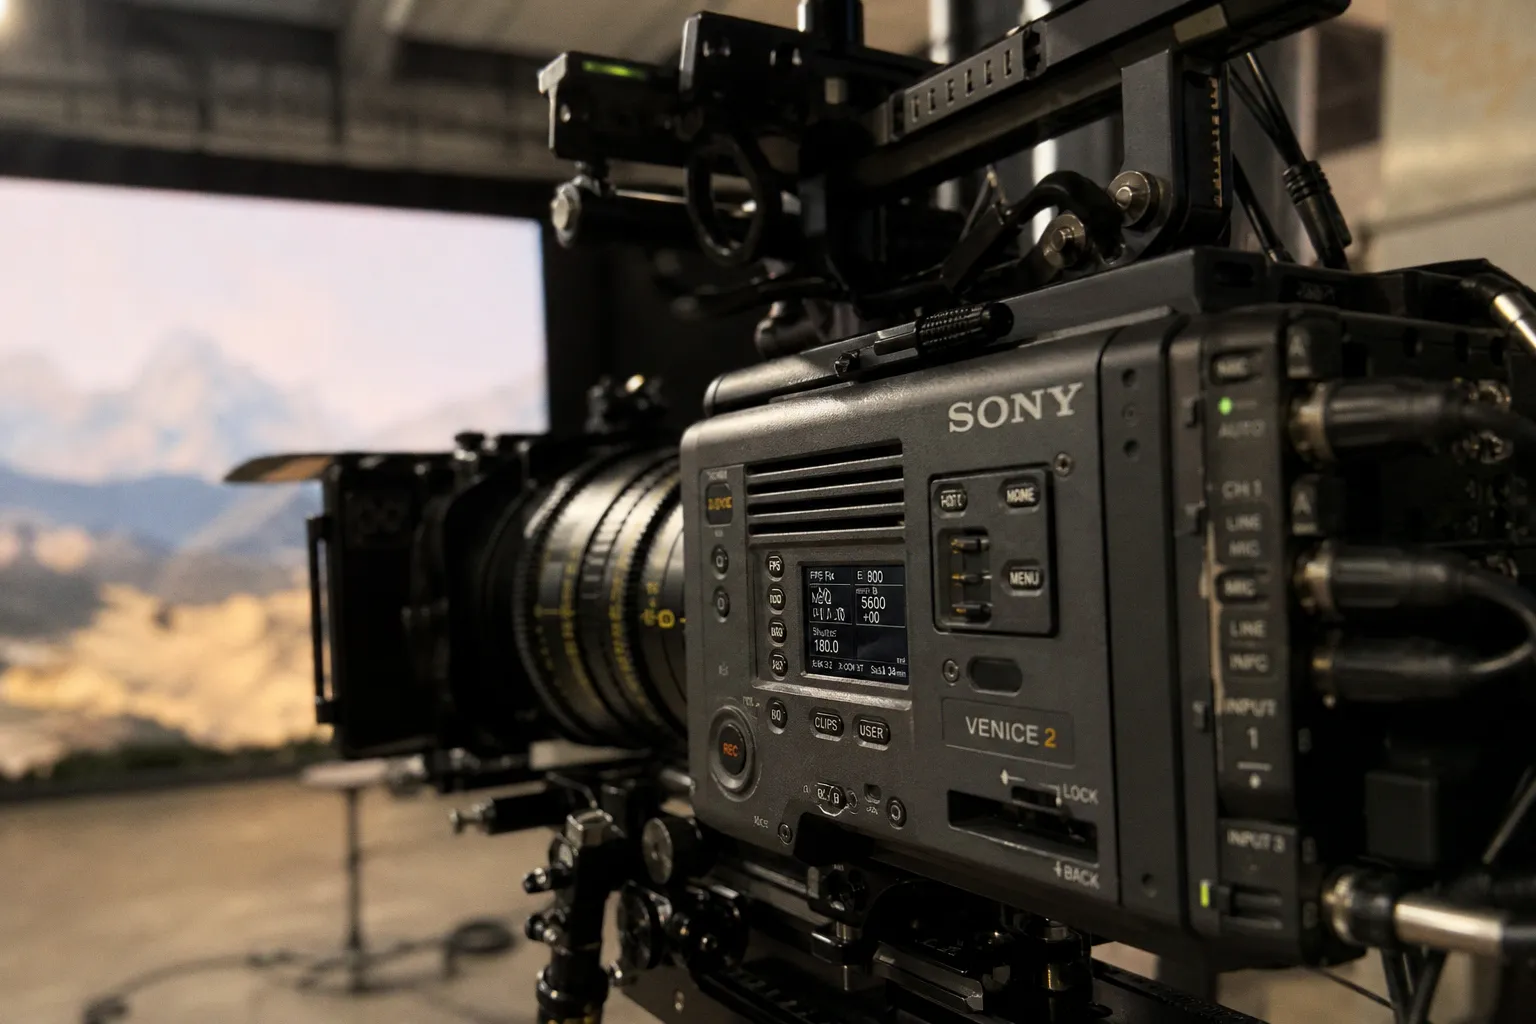
Hardware requirement: a camera capable of 120 fps minimum, 240 fps preferred. The Sony FX6, RED Komodo, and Blackmagic URSA 12K all qualify. Phone cameras generally do not — their rolling shutter and processing pipeline obscure the reference points.
Setup procedure:
1. Mount the high-speed camera on a tripod roughly 1.5 m from the LED wall surface.
2. Frame a shot that captures both the physical tracking marker (a printed cross or QR-style fiducial) and the corresponding virtual element rendered on the wall.
3. Trigger a sharp, single-axis motion — a horizontal whip pan of the production camera, executed in under 200 ms.
4. Record at 240 fps with a fixed shutter speed of 1/1000 s at f/4 to eliminate motion blur and exposure variance in the reference frames.
The high-speed camera now holds two synchronized streams: the real-world fiducial movement and its virtual counterpart as rendered on the wall. The frame offset between these two streams is the visible latency in milliseconds. At 240 fps, one frame equals 4.16 ms. Count the offset, multiply, and you have your baseline.
At 240 fps, one frame of offset equals 4.16 ms of glass-to-glass latency. Beyond two frames in a 24 fps final output is visible to a trained eye on a whip pan.
Lighting matters. Set the LED wall to a high-contrast test pattern — a single white cross driven at 100 IRE against pure black (0 IRE), no gradients, no anti-aliased edges. Gradients and softness destroy the frame-edge definition needed to read precise offsets. Calibrate the wall output to at least 80 foot-candles at the test cross to ensure the fiducial reads cleanly through any ambient spill on set.
Step 2: Analyze Frame Offsets via Live Link Debug
Unreal Engine ships a built-in diagnostic for exactly this problem: the Live Link Debug panel.
Access path: Window → Live Link → Debug. With the tracking source active and the production camera moving, the debug panel exposes three values in real time.
| Parameter | What It Tells You | Target |
|---|---|---|
| Timecode offset | Delta between tracking timecode and engine timecode | 0–1 frame |
| Frame age | Frames the transform is behind the latest render | 0–2 frames |
| Source status | Whether the tracking feed is dropping packets | Green |
Timecode offset is the headline metric. If the engine timecode lags the tracking timecode by more than one frame, you have already lost synchronization on the render side. The tracking data is current; the engine is rendering stale transforms.
Frame age tells you whether the feed itself is current. A frame age of 0 means the transform was generated this frame. A frame age of 2 means the tracking system is delivering data two frames late — a problem you cannot solve inside Unreal.
For proprietary systems, vendors run their own diagnostic suites. Mo-Sys reports internal latency in the Alpha Pro UI. OptiTrack's Motive software exposes per-camera latency in the device panel. Run these in parallel with Live Link Debug. The vendor tool reports the tracking system's contribution; Live Link reports the engine's. The difference is your render-side budget.
Record the Live Link Debug values during the same whip-pan motion used in Step 1. Cross-reference the high-speed frame count with the engine's reported offset. If the high-speed capture shows a 3-frame visible delay but Live Link reports a 1-frame offset, the remaining 2 frames live in the LED controller or the scan chain. That gap is where most crews lose time chasing a problem that does not exist in the engine.
Step 3: Calibrate nDisplay for Real-Time Synchronization
The nDisplay system allows you to compensate for known tracking latency. This step does not eliminate latency. It aligns the engine's render clock to the camera's exposure window so the visible offset sits inside a single frame pair.
Procedure:
1. Open the nDisplay config file (`nDisplay.ini`) and locate the `[latency]` block.
2. Set `Latency = <measured_frame_offset>` as a fraction of the engine framerate. For a 60 Hz engine and a 2-frame measured delay, the value is `2/60 = 0.0333`.
3. Restart the nDisplay cluster to load the new value.
4. Re-run the high-speed capture from Step 1.
5. Compare the new frame offset against the baseline.
If the offset drops to 1 frame or less, the compensation is working. If it does not change, the bottleneck is downstream — most often the LED controller's scan period, which runs independently of the engine clock. In that case, no amount of nDisplay tuning will fix the visible lag. You need a controller with lower scan latency, or you accept the offset as a hard ceiling on the build.
For multi-node volumes, run the calibration per node. Each cluster's render time varies based on its viewport allocation. The cluster rendering the most pixels carries the longest render time and therefore the largest required compensation. A 4K node runs hotter than a 1080p preview node — measure both.
Acceptance Thresholds
Unreal Engine 5.3 documentation does not specify a single acceptable latency value. The 0–50 ms range is consistent with most professional setups I have measured, but it is not a hard target — it is an observation, not a published tolerance.
For 24 fps final delivery on a moving camera shot:
- 0–20 ms: locked. No visible offset on a whip pan.
- 20–35 ms: borderline. Static shots pass; camera motion exposes the delay.
- 35+ ms: failed. Every camera move reveals the lag.
For 30 fps broadcast or 60 fps live-to-air work, the thresholds tighten by roughly 30%. A 35 ms delay that is invisible at 24 fps becomes a perceptible slip on a fast-twitch live feed. The line between scripted virtual production and live event workflows keeps narrowing — broader coverage of that shift sits at outlets like Nevlan News alongside the more specialized virtual production beat.
Manufacturer claims of "zero latency" tracking refer to the tracking system's contribution, not the glass-to-glass chain. Treat those numbers as marketing.
Final Verdict
The three-step workflow works. Step 1 establishes a measurable baseline via high-speed capture. Step 2 isolates the engine's contribution through Live Link Debug. Step 3 aligns the render clock to the camera through nDisplay compensation. Total time to execute: under 90 minutes on a configured volume.
What the workflow cannot do: eliminate hardware latency in the LED controller, reduce sensor readout time, or compensate for a tracking system delivering stale data. Those are physical limits, not software problems.
If your measured offset exceeds 2 frames after calibration, the chain has a hardware bottleneck that no nDisplay setting will fix. Stop tuning the engine. Audit the controller and the tracking feed instead.