At 60Hz, a virtual production stage gets 16.67 milliseconds to deliver each new frame.
Miss that window often enough and the failure is not subtle: the LED wall loses its rhythmic certainty, the camera-visible world stutters, tracking slips out of sympathy with the image, and a director who was looking at a convincing horizon a moment ago is suddenly staring at the least cinematic thing on set—a frozen render node.
I have heard this moment before I have seen it. Not literally in the GPU, of course, but in the room: the low mechanical churn of anxious conversation, the sharper cadence of someone refreshing a monitoring panel, the boom operator asking whether we are holding, and the LED processor fans beginning to sound like they have opinions. A crash in Unreal Engine virtual production is rarely one clean failure. It is a chain of timing errors, memory pressure, poorly behaved assets, and optimistic assumptions arriving at the same frame.
The recurring message is familiar: “GPU crashed or D3D device removed.” On a conventional Unreal Engine 5 filmmaking job, that can be irritating. In an ICVFX workflow, with talent on the floor, a camera tracking system live, and an LED wall production consuming power by the kilowatt, it is expensive silence.
A virtual set does not fail because one machine is weak. It fails when the whole pipeline stops keeping time.
The anatomy of a real-time crash on set
The first mistake is to treat an Unreal crash as a single-computer problem. In real-time environment rendering, the render node is only one instrument in a very tightly timed ensemble.
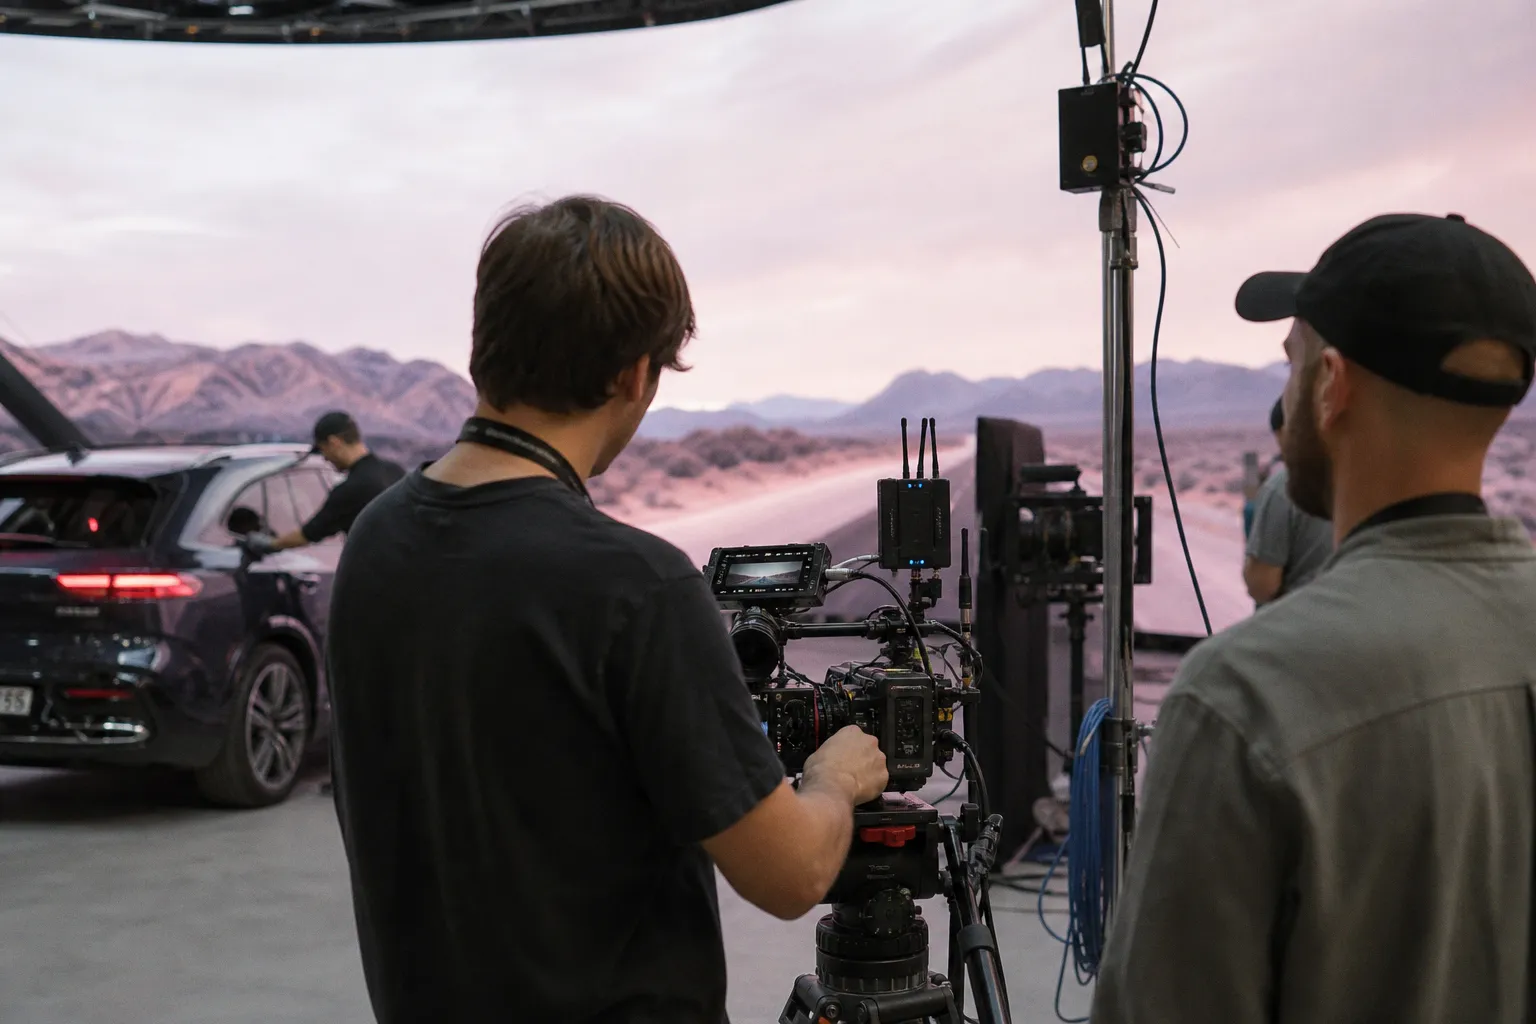
The camera sends positional data. The tracking system updates the virtual camera. Unreal calculates the scene. nDisplay distributes the render workload. The LED processor receives the image. The wall refreshes. Then the physical camera sees that wall again, all while the production expects the image to remain coherent through movement, shutter angle, exposure changes, and the practical realities of glass-to-glass latency.
Professional workflows commonly live with glass-to-glass latency of three to five frames. That can be manageable because the pipeline is consistent. The danger begins when the latency is not merely present but unstable. A predictable delay can be compensated for; a delay that expands, contracts, and occasionally lurches is where eyelines start to feel wrong and tracked parallax becomes faintly seasick.
There are several failure signatures I look for before blaming Unreal itself:
- A clean application exit with a D3D device-removed message usually points toward GPU timeout behaviour, driver instability, or a render task that took longer than Windows was willing to tolerate.
- A gradual framerate decline before the crash often suggests VRAM saturation, thermal pressure, or a scene whose asset budget was never designed for the actual LED resolution and inner-frustum demand.
- A wall that runs but drops cadence is often nDisplay synchronization trouble rather than a conventional application crash. One weak node can pull the whole cluster below its required rhythm.
- A failure that appears only during a tracked take may involve the camera-visible inner frustum, high-resolution reflections, real-time shadows, or an interaction between tracking updates and an already overloaded GPU.
- A scene that behaves perfectly in a desktop preview but collapses on stage is usually a reminder that a virtual set design is not validated until it is tested at its true display, render, and synchronization load.
This is where audio has made me unforgiving. In a mix, one does not call it “fine” because the dialogue is intelligible in isolation while the music masks consonants, the production sound carries a rising noise floor, and the transient detail disappears under limiting. The same discipline applies here. A virtual scene can look immaculate in an editor viewport and still be structurally unfit for a live wall.
The image is not the only output. The reliable frame is the output.
The GPU timeout is Windows protecting itself, not protecting your take
The D3D device error has acquired the kind of mythology that surrounds all intermittent failures. People restart the machine, lower a setting, clear a cache, reinstall a driver, and wait to see whether the problem has been appeased. That is not diagnosis. That is ritual.
One frequent cause is Windows Timeout Detection and Recovery, or TDR. Windows watches the GPU. If it believes the GPU has taken too long to complete a task, it can reset the driver rather than allow the system to remain locked. Unreal then loses the graphics device and reports the crash.
The crucial phrase there is “too long.” A single frame that becomes computationally grotesque—perhaps because a dense scene enters view, a reflection update spikes, a shader compilation process intrudes where it should not, or the inner frustum demands more than the GPU can supply—can be enough to trigger the sequence.
Increasing the TdrDelay value in the Windows Registry is a standard production remedy. It gives a long-running GPU task more time before Windows declares it dead. But it must be treated as a controlled intervention, not a magic performance upgrade.
A longer TDR window can prevent Windows from interrupting a recoverable heavy frame. It cannot create VRAM that is not there. It cannot repair a broken nDisplay configuration. It cannot turn an unstable scene into a stable one. What it does is remove one hair-trigger from a system that may otherwise be capable of completing the task.
My order of operations is deliberately unglamorous:
1. Reproduce the failure with the same map, camera route, wall resolution, and tracking load. A crash that happens “somewhere around the fast dolly move” is not a reproducible event. Record the exact camera position, lens state, inner-frustum configuration, and scene transition.
2. Read the crash pattern before altering settings. Is GPU utilization pegged? Is VRAM nearly exhausted? Does the error occur at the same moment? Does the failure disappear when the camera is static? Those answers separate timing pressure from general instability.
3. Update and standardize the production driver stack. For virtual production, stable Studio drivers are generally the sensible baseline. The driver choice should be identical across comparable render nodes wherever the deployment permits it.
4. Adjust TDR only after establishing that the frame can actually complete. If the GPU is simply being asked to render an impossible scene in the allotted cadence, extending the timeout only means waiting longer for the next crash.
5. Retest under load, not in a quiet editor session. Bring back the tracker, the LED output path, the real wall timing, and the camera-visible content.
A production workstation also needs enough electrical headroom. High-end virtual production builds can recommend a 1400W power supply because a GPU, CPU, storage, capture hardware, and peripheral load do not politely take turns. Power instability has a texture of its own: failures that seem random, often arriving when the scene is at maximum complexity. Do not confuse that with a purely software problem.
TDR is a safety valve. If it keeps opening, listen to the pressure in the system.
VRAM: the memory ceiling nobody sees until it falls
VRAM failure is cruel because it often announces itself late. The scene opens. The wall looks excellent. Everyone relaxes. Then the camera turns toward the expensive part of the world—the forest with high-resolution foliage, the wet street with layered reflections, the architectural interior assembled from older Marketplace assets—and memory consumption rises past the point where the GPU can remain composed.
For serious Unreal Engine virtual production, 24GB to 48GB of VRAM is a practical range often considered for high-end workstations, with GPUs in the RTX 3090, RTX 4090, or RTX 6000 Ada class commonly entering the conversation. System RAM is another part of the equation: 64GB is a workable production floor, while 128GB to 256GB gives larger projects more room to breathe.
But specifications are not immunity. I have watched very capable GPUs choke on scenes that were “optimized” only in the sense that nobody had yet placed them in a real-time LED workflow.
Older Marketplace assets are a regular offender. Many were built before Nanite became the expected route for handling complex geometry in UE5. They may carry inefficient meshes, bloated texture sets, aggressive material complexity, or reflection settings that make sense for a cinematic offline render but become punishing when multiplied across a large display pipeline.
The term “Out of Video Memory” is not always a neat, literal explanation of every byte allocation. Still, when it appears around a dense virtual set, I start with the scene budget rather than assuming the engine is being temperamental.
| Pressure point | What it does to the stage | Practical response |
|---|---|---|
| Non-Nanite legacy geometry | Raises geometry and draw-call burden, especially in dense environments | Audit older assets; rebuild, replace, or simplify assets that do not justify their cost |
| Oversized textures | Consumes VRAM quickly, often with little visible benefit at the actual camera distance | Set texture budgets by lens distance and screen occupancy, not by asset-library pride |
| High Reflect Capture Resolution | Can quietly reserve significant GPU memory | Reduce Reflect Capture Resolution in project settings and retest the sequence |
| Heavy real-time reflections and shadows | Creates frame-time spikes during camera motion | Prioritize the camera-visible area; simplify what the lens will not interrogate |
| Duplicate materials and unbounded variants | Bloats shader and texture residency | Consolidate materials and remove variants that have no on-stage purpose |
Reflect Capture Resolution deserves special attention because it is easy to overlook. Reduce it thoughtfully, test the result on the wall, and you may free useful VRAM without damaging the perceptual read of the environment. That last clause matters. A numeric gain in monitoring is worthless if the LED image becomes flat, plasticky, or loses the material cues that made the set believable.
This is where psychoacoustics offers an unexpectedly useful discipline. Human hearing does not judge every frequency with equal importance; it responds to masking, contrast, temporal detail, and context. Viewers do not inspect every rendered pixel with equal severity either. In virtual set design, spend the GPU budget where the camera and the audience will actually perceive it: the near-field detail, the reflections that establish scale, the interactive light that binds talent to background, the parallax-sensitive structures in the inner frustum.
Do not spend it on invisible mathematical vanity.
LED pixel pitch belongs in that same conversation. A standard stage viewed at roughly 8 to 15 metres often uses a 2.3mm to 2.6mm pitch. In smaller spaces, 1.8mm can be necessary to reduce moiré. But chasing a dramatically smaller pitch as an automatic upgrade is poor systems thinking. It raises cost and may solve a problem your lens, camera distance, and shooting plan do not actually have.
The wall is part of the render budget. Treat it that way from the first technical scout.
nDisplay is a timing system before it is a distribution system
A multi-node nDisplay setup can look robust on a diagram and still fail in the exact way a poorly aligned multitrack session fails: every individual element appears to be running, yet the whole thing lacks phase coherence.
The render nodes must agree on frame timing. They must exchange data with sufficiently low and consistent overhead. They must meet the expected output cadence. And they must remain aligned when the project enters the worst part of the scene, not merely the opening shot with a blue sky and a static horizon.
There is a documented case in which a three-PC configuration dropped to 45Hz rather than the required 60Hz because communication overhead and skipped VBlanks ate into the timing budget. That gap is not decorative. At 45Hz, the system is no longer delivering the smooth, stable output the rest of the stage expects.
I approach nDisplay problems by isolating the cluster in layers.
Start with a single-node truth test
Before distributing the scene, make one machine render the intended workload at the intended resolution and framerate. Not approximately. Not at a reduced preview size. The same camera-visible region, target display output, key sequences, lighting state, and content transitions.
If the single node cannot sustain the scene, a cluster will not rescue it. It will add synchronization and network considerations to an already unstable render.
Match nodes like matched microphones
In critical audio capture, you do not casually pair a pristine condenser with a battered unknown capsule and call the result stereo. Their response curves, sensitivity, and phase behaviour matter.
Render nodes deserve the same seriousness:
- Keep GPU models and driver versions consistent where possible.
- Keep Unreal project versions, plugins, nDisplay configurations, and operating-system updates aligned.
- Avoid giving one node a materially different storage, thermal, or background-process profile.
- Verify that display and synchronization hardware are configured consistently across the cluster.
- Monitor not only average frame rate but frame-time spikes, skipped VBlanks, and node-to-node divergence.
The average number lies. A system can report a respectable mean framerate while producing occasional long frames that the eye catches immediately in a tracked shot. It is the visual equivalent of a clean dialogue track punctured every twenty seconds by a hard digital click: the average loudness tells you nothing about the interruption.
Keep the network boring
A virtual production network should be aggressively boring. Dedicated where possible, predictable, properly configured, and not carrying unrelated traffic because someone had a spare switch and a hopeful expression.
nDisplay performance can degrade through communication barriers between nodes. That means the network is not merely a cable path; it is part of the render engine’s timing behaviour. If synchronization is unstable, inspect the complete chain: node health, network configuration, display pipeline, timing source, and the precise moment the frame cadence falls apart.
Do not wait for the wall to reveal the problem during a take. Run a sustained stress pass. Loop the most expensive camera move. Keep it running long enough for thermals, memory residency, and periodic background activity to make themselves known.
UE 5.4 gave the inner frustum its own room
Unreal Engine 5.4, released in April 2024, introduced a virtual production feature that addresses one of the most rational places to spend render resources: Multi-Process Inner Frustum rendering.
The idea is straightforward but significant. A dedicated render node can handle the camera-visible inner-frustum area, while the rest of the display workload remains elsewhere in the system. For ICVFX, this is a better expression of production priority than simply asking every node to carry every part of the problem.
The inner frustum is where the physical camera is looking. It is where resolution, perspective, detail, and interactive believability are most heavily scrutinized. Giving that region dedicated GPU attention can reduce contention and help prevent the crashes that occur when a single node is asked to shoulder both the broad LED canvas and the most demanding camera-visible render.
That does not mean Multi-Process Inner Frustum rendering makes a scene invulnerable. It does not. A badly budgeted environment remains badly budgeted. A broken material remains broken. An unstable tracking chain remains unstable. But it gives a production a more intelligent way to allocate hardware resources.
I would use it when the camera-visible region is substantially more expensive than the surrounding outer frustum: close detail, high-frequency texture work, demanding reflections, dense geometry, or a shot where the talent-camera relationship requires the environment to hold up under motion.
The operational questions are more useful than the sales pitch:
1. Which node owns the most perceptually important pixels? The answer should be the inner-frustum node, not whichever machine happened to be easiest to configure.
2. Can that node sustain its role through the heaviest shot? Test lens changes, fast pans, foreground occluders, lighting transitions, and the content that will appear in the final take.
3. Does the outer-frustum workload stay stable when the inner frustum intensifies? The cluster must remain coherent; relocating pressure is not the same as removing it.
4. Is the production team monitoring the right signals? GPU memory use, frame-time consistency, node synchronization, thermals, and wall output are all more meaningful than a single “it seems smooth” judgment.
This is the difference between building a real-time system and merely assembling powerful parts.
Stability is an aesthetic decision
The strongest virtual production work makes technology disappear into performance. The actor responds to a horizon that is truly there. The cinematographer sees the relationship between foreground and world in the lens. The lighting team gets real spill and reflected colour. The sound team gets fewer arguments about whether the background should feel “more present,” because the physical environment has already given the performers something coherent to inhabit.
None of that survives a pipeline that crashes at the edge of every ambitious shot.
When our real-time render went down, the immediate temptation was to solve the visible symptom: restart Unreal, reload the cluster, get the wall alive, move on. That is how a stage acquires recurring ghosts. The more useful response was slower and more exacting—find the frame that broke cadence, trace the VRAM pressure, examine the legacy assets, verify the node synchronization, and decide whether the inner frustum was consuming resources in the right place.
Unreal Engine virtual production is not fragile because it is immature. It is demanding because it asks a live system to do what used to be separated across departments and days: render, track, display, photograph, and respond in the same breath.
The crash is never the story. The timing discipline you build afterward is.